
EXFO FTB portable test platforms

Data Center Test Solutions
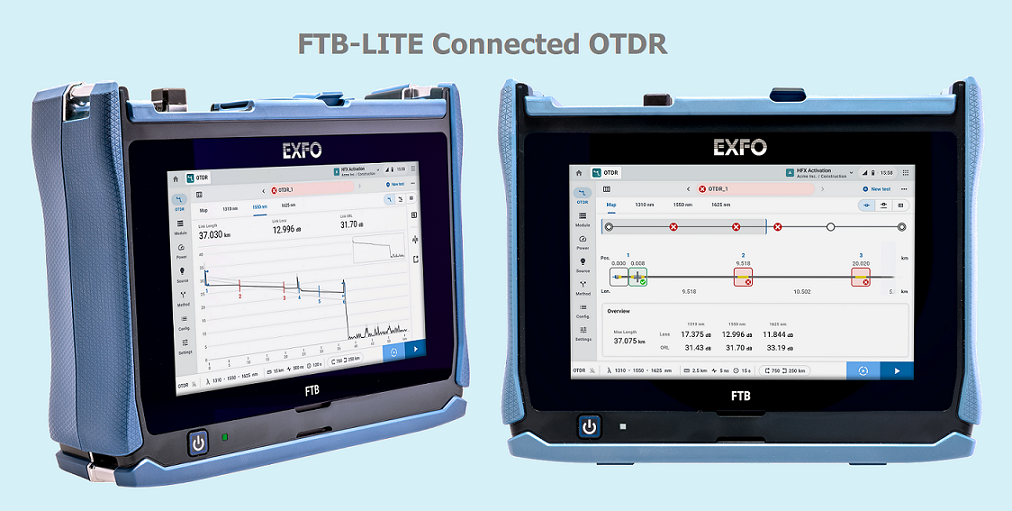
OTDRs driving unmatched field efficiency with always-on connectivity on a rugged platform

D Series OTDR line with Swap-out Connector

AXS-120 - Last-mile/Access mini-OTDR

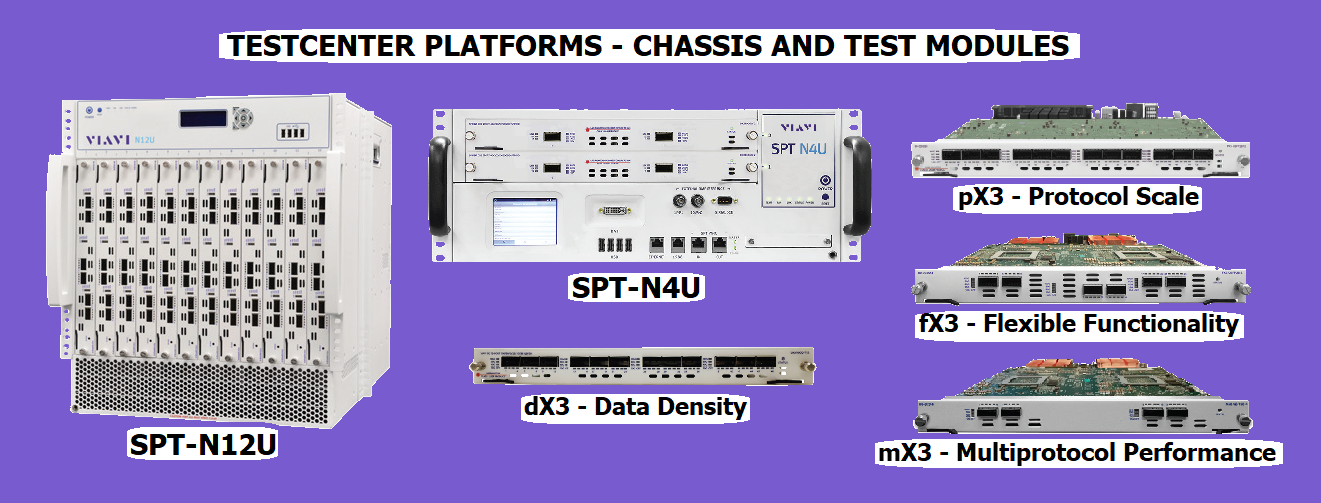
VIAVI TESTCENTER Platforms- Chassis and Test Modules

Fitel S179+ Fusion Splicer and Fitel S327 High Precision Optical Fiber Cleaver
Intelligent Optical Spectrum Analyzer
[su_spacer]
As the demand for increase in bandwidth continues to grow at a tremendous pace, service providers have no choice but to ride the wave and adapt their networks so that they can offer more services to their customers. Yet with new technologies getting closer down the road and the concern for limiting costs, providers are faced with difficult choices. In this context, upgrading from a 10 Gbit/s to a 40 or 100 Gbit/s advanced modulation format becomes a necessity—but not at any price.
The three main drivers behind each upgrade is that service providers want to use existing fibers and network elements, to maximize revenues from infrastructure already in place; they want to improve operation flexibility, which translates into more efficient provisioning and increased revenues from new services to their customers and they want to increase the density of the network elements. As space in the central office is limited, energy to operate and maintain those elements needs to be rationalized, therefore using fewer interfaces and simpler network topology is the way to go.
However, these requirements add to the challenge as new modulation rates (40 Gbit/s and 100 Gbit/s) come with many constraints on existing networks. Upgrading from 10 Gbit/s to 40 Gbit/s, or even to 100 Gbit/s, has a significant effect on the tolerance to optical impairments such as the level of noise with the signal, chromatic dispersion (CD), differential group delay (DGD) and polarization mode dispersion (PMD), as well as the bandwidth of the filters present in the network. For example, upgrading from 10 Gbit/s to 100 Gbit/s means that to achieve the same level of service, optical signal-to-noise ratio (OSNR) needs to be 10 dB higher, and CD and DGD 10 times smaller.
Once the decision has been taken to upgrade an existing network to an advanced modulation format, the first step to take is to verify the characteristics of the existing network to ensure that they will sustain the new modulation formats according to the vendors’ specs.
After it has been established, through link characterization, that the existing network is suitable for a 40 Gbit/s upgrade, the next step is the selection of the most appropriate system and its installation and commissioning in the field:
- Transmission performance tests measure transmitter and receiver performance, optical amplifier performance, error behavior and related effects that accumulate through wavelength-division multiplexer (WDM) network elements, as any issue will have a direct effect on the revenues of the service provider
- Center wavelength and signal power are measured with the optical spectral analyzer (OSA) and then another important parameter is the OSNR since it gives an indirect appreciation of the overall performance of the system for all channels at once, in a very short time period.
OSNR is an excellent way to provide a representation of all the optical noise effects. The OSNR is the ratio between the received signal and the additive noise of the optical link, providing a summary of all the noise effects present on an optical link. (Typically, the ASE noise of optical amplifiers is the dominant component of OSNR.)
There is a direct relationship between OSNR and bit error rate (BER); higher OSNR leads to a lower BER. Optical-network operators want their networks to operate at low error rates and typically look for BERs in the order of 1×10-12 to 1×10-15. The required bit rate on a specific optical link can be extrapolated directly to a required OSNR. If the measured OSNR is higher than what is required for delivering the desired BER, additional margin exists in the optical link, which can be used to transmit more wavelengths, send signals over a longer distance or increase the bit rate of the transported data—all of which improve the overall capacity.
[su_spacer]
The Challenge in Measuring OSNR
Optical signal-to-noise ratio (OSNR) has long been recognized as a key performance indicator in wavelength-division multiplexing (WDM) networks, because it provides a multichannel assessment of signal quality in a very short time.
OSNR also predicts bit error rate (BER) within just a few minutes, while typical BER tests must run for hours or days.
By measuring OSNR and channel spacing on a given fiber,optical spectrum analyzers indicate if it is possible to substantially increase the number of channels and hence total bandwidth. By allowing an increase in channel count or transmission speed via spectral width validation at each wavelength.
The advent of higher data rates and new components have led to the introduction of three different OSNR methods depending on the network’s characteristics:
- IEC 61280-2-9 for 10G and below, without ROADMs
- In-band OSNR, for 10G with ROADMs, or 40G noncoherent networks
- Pol-Mux OSNR for coherent 40G/100G
The IEC 61280-2-9 standard defines OSNR measurement as the power ratio between the signal power and the noise at half the distance between the peaks. However, in ROADM or 40 Gbit/s systems, this method may lead to incorrect results, because the noise level between the peaks is no longer directly correlated with the noise level at the channel wavelength. EXFO’s in-band OSNR is the answer to this challenge.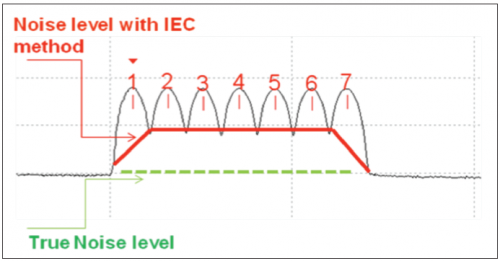
For Pol-Mux signals at 40G and 100G, neither the IEC nor the in-band method work. This calls for a new measurement method: Pol-Mux OSNR.
[su_spacer]
EXFO Solution : FTB-5240S-B/P Intelligent Optical Spectrum Analyzer
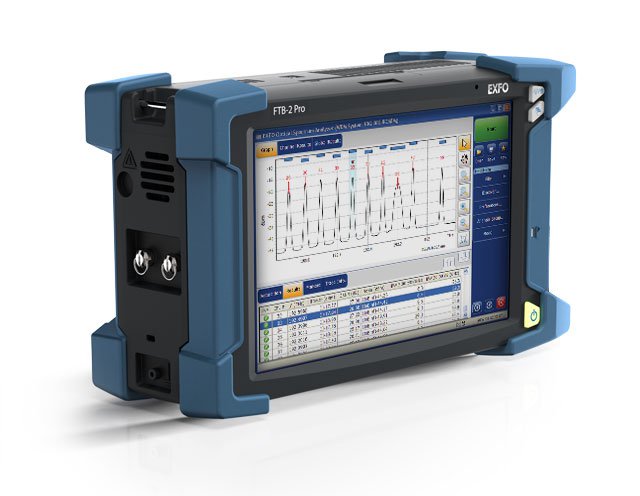
EXFO FTB-2 Pro with FTB-5240S-B/P OSA Module
The FTB-5240S and FTB-5240BP Optical Spectrum Analyzer (OSA) series covers your DWDM applications and all channel spacings, from 25 GHz DWDM to CWDM. This is what we call “no-compromise performance,” whatever your network specificities and testing requirements.
EXFO’s OSA offer:
- Commissioning Assistant, the first Pol-Mux OSA for 40G/100G coherent DWDM systems
- WDM-Aware i-in-band, the most accurate and adaptive in-band method on the market for intelligent setup and analysis on a per-channel basis
- WDM Investigator delivers detailed information about the signal and noise for each channel and efficient impairment identification (Pol-Mux signals, carved noise, crosstalk, nonlinear effects, carrier leakage and PMD pulse spreading)
- One-button operation for easy setup and automatic measurement
- Fast and cost-effective in-service PMD analysis option
- Flexibility to analyze WDM, EDFA, drift, spectral transmittance and Fabry-Perot and DFB laser
![wdmaware]](https://www.khrista.co.id/wp-content/uploads/2016/03/wdmaware.png)
( For more information about FTB-5240S-B/P OSA, click here )